


|
|
|
|
|
|
| |
| 04-DEC-2011 | |
See the main Beta Pictoris page for full details: http://www.pbase.com/rolfolsen/beta_pictoris
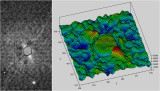
I used MaximDL to produce some more in-depth illustrations of what is going on in the difference image. This is an area plot of the intensity immediately around Beta Pictoris. The circular plateau in the centre corresponds to the saturated area caused by Beta Pictoris itself (The narrow trough immediately surrounding it is an artifact of the image processing). The debris disc is visible as the elevated red areas on each side of the star.
Copyright Rolf Wahl Olsen 2011