


|
|
|
|
|
|
| Duncan | profile | all galleries >> Fractal Images >> Mandelbrot/Julia morphology study >> Elephant valley plots | tree view | thumbnails | slideshow |
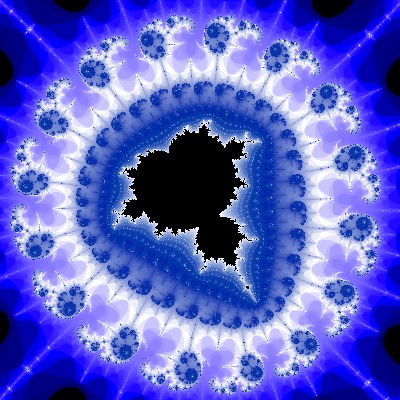
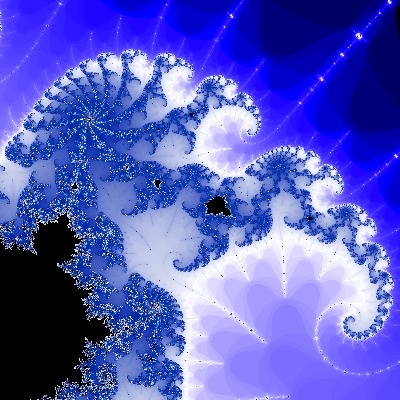 1 Elephant with tendrils |
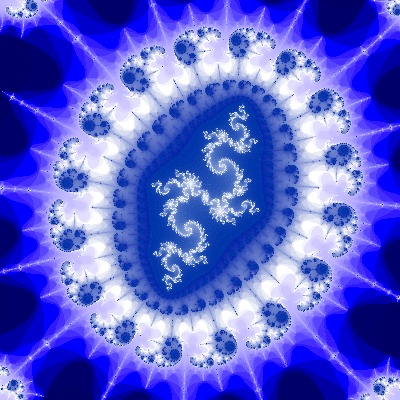
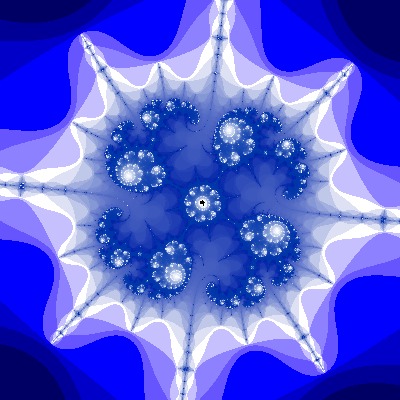 2 spot on tendril |
 2 Julia spot on tendril (C point) |
 2 Julia spot on tendril (center) |
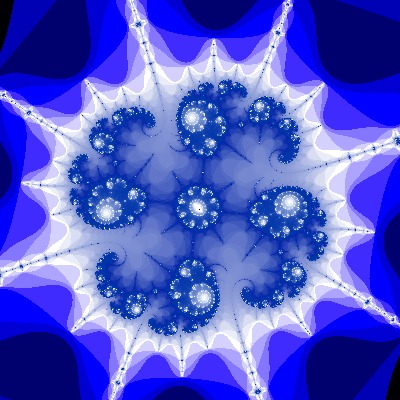
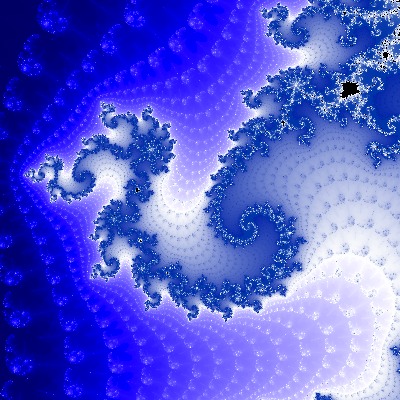
 3 tendril baby mandel |
 3 tendril baby mandel seahorse valley julia (centered) |
 3 tendril baby mandel seahorse valley julia |
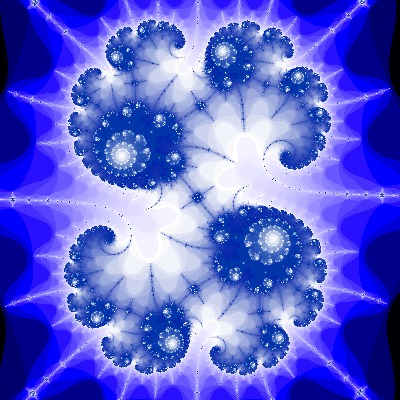
 4 tendril baby mandel dragon |
 4 tendril baby mandel dragon Juila (C) |
 5 tendril baby mandel dragon detail |
 5 baby mandel dragon julia detail |