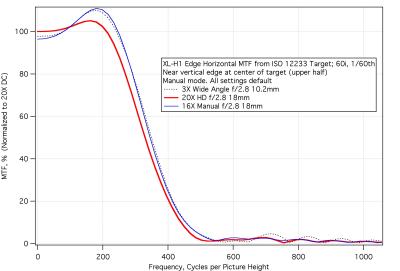
These MTF curves are derived from the near vertical edge of an ISO 12233 resolution chart by the method described with the previous image. As such they represent the horizontal resolution of the camera/lens combination. The horizontal axis is in units of cycles per picture height. This corresponds approximately to line pairs per picture height and thus twice the numbers on the axis is the approximate number of lines per picture height. As the plot shows all three lenses have about 20% response at 400 cycles and this tends to confirm observations of about 800 lines resolution.