photo sharing and upload picture albums photo forums search pictures popular photos photography help login
Gordon W | profile | all galleries >> Tips & Techniques Galleries >> A Basic Explanation of Curves tree view | thumbnails | slideshow

A Basic Explanation of Curves

Also known as 'Tone Curves'

First, a little about RGB files

A digital RGB file (RGB being an acronym for Red, Green, and Blue, the primary colors of light) is the standard mode for the vast majority of digital imagery and is simply a combination of three grayscale images, one for each of the three primary colors of light that occurred in the scene you photographed and when you open that digital image file in an image editor (Photoshop being the one I use, but they all work basically the same way) those grayscale images are put into their appropriate channels and combine to produce a reasonable facsimile of the color in the scene you shot.


There are other modes for color images (for instance, CMYK, LAB, etc.), but they too simply combine grayscale images in their channels, just combining them in different ways, however for the sake of simplicity and because RGB is the native mode digital sensors record and output (as did film in its day), we’ll stay with it for our explanation here.

Everything that’s done to that image file while editing it are simply alterations made to those three grayscale channels. It’s that simple and when a person really gets a grasp of that concept, that person is then in absolute control of image editing.


Now for the (Tone) Curves

Every digital image (or more specifically, each of the grayscale images in the RGB channels that comprise it) has a point representing black and a point representing white and the tones of the image either fall between those two points or are clipped into digital oblivion if they extend beyond them, which is generally something to avoid unless one is processing for an effect that requires it.

How the tones of an image are distributed between or beyond the black and white points of each RGB channel completely determines how the image will look.

The Levels command gives control over the black and white points, plus a midpoint that essentially sets the gamma of the image (basic darkness or lightness), while the Curves command not only gives control over the black and white points, it also gives control over every point inbetween, so Curves is a much more powerful command.

In fact, I consider it the most powerful command because there isn’t much you can do with other commands that can’t also be done with Curves, the other commands simply use different interfaces. So, if I was limited to just one command, I would choose Curves, especially if one’s Curves command includes the histogram display (a graph showing how the tones of the image are distributed in relation to the all-important black and white points).

Click the first image below to see the Curves of an unaltered image. When viewing these images, clicking either ‘previous’ or ‘next’ in the image window or the ‘Back’ and ‘Forward’ buttons in your browser window toolbar will best show you how the changes effected the image.

(There is much more that can be done with Curves than I show in this initial posting, like applying Curves with a selection mask. I'll add more as time and motivation allows.)
Linear
Linear
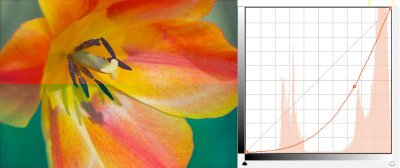
White & Black Points
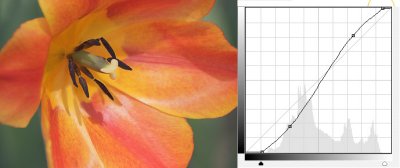
Contrast Increase
Contrast Increase
Locate Point
Locate Point
Alter Point
Alter Point
Background Mask
Background Mask
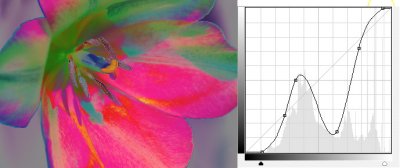
Color Cast & Correction
Wild & Fun-key
Wild & Fun-key