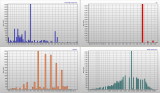
Output from a neat free download program, Exposure Plot. The program analyzes photos EXIF data and prepares a plot of useage for (CW from upper left) - focal length (in 35mm terms; multiply these by 2/3 to see what I actually used), ISO, shutter speed, aperture. In this case it analyzed about 15,000 images taken over the past year.
Besides being of general interest, the results are useful when you're considering a new lens.
The focal length data, with the spike at near 150-160mm shows me what is no surprise - I do a lot of macro work with my 105mm Nikkor 1:1 lens (it's 157.5mm in 35 mm terms). My other lenses are 12-24 (18-36 in 35mm), 18-70 (27-105 in 35mm) and a 75-300 (you can work it out). I also occasionally use a 1.4x TC which gives me 630mm (in 35 mm terms) when used with the 300 zoom. It's easy to pick out all of these lenses in the data - and how often they're used. I have no idea where the focal lengths above 630 came from.
ISO data - 200 is the lowest ISO my camera offers and I use it most of the time.
Shutter speed and focal lengths - I guess there's a message there.