******PLEASE CLICK ON AN IMAGE TO SEE BETTER DETAIL******
For this test I wanted to:
#1 Show the relationship of loaded voltage to SOC on a popular lead acid battery.
#2 Utilize a battery not in perfect health.
#3 Show why using generic voltage to SOC charts may not work for your battery bank.
#4 Show the actual rebound voltage after discharging to 50% SOC under controlled conditions.
22-JAN-2016
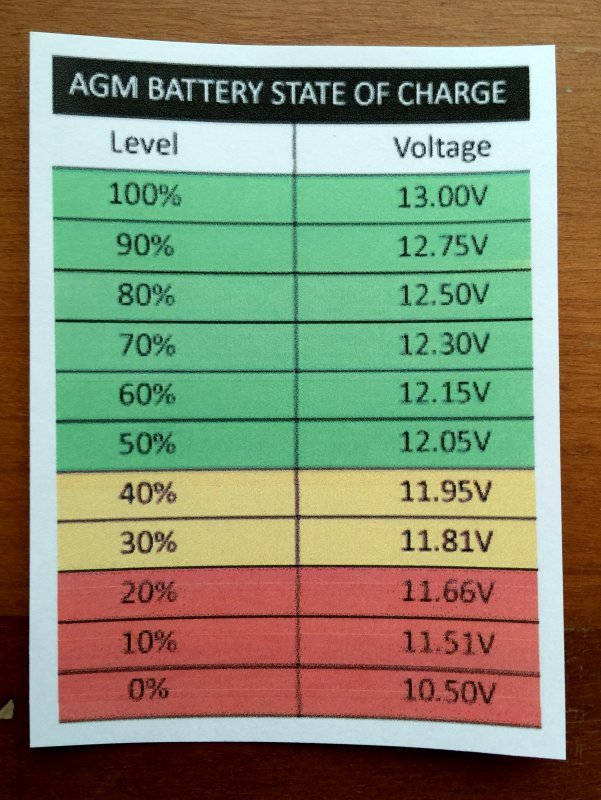
Customers SOC Resting Voltage Chart
This image is an epic fail on my customers part. He found this voltage to SOC chart on the net and I found it on his chart table. He was using it with resting voltages not loaded voltages as this chart was likely developed from.
If we examine this chart to the 20 hour rate loaded voltages in my test here they line up pretty closely but if using a chart like this for a RESTING VOLTAGE you will be murdering your batteries.
___Chart V___Test V
90% 12.75V > 12.55V
80% 12.50V > 12.50V
70% 12.30V > 12.37V
60% 12.15V > 12.24V
50% 12.05V > 12.11V
Some charts on the net are for resting voltages and some of them are for 20 hour rate loaded voltages. If using voltage as an indicator of SOC the rate of discharge can affect your SOC to voltage points. Using the WRONG CHART only exacerbates this and makes your method of murdering your batteries even worse.
21-JAN-2016
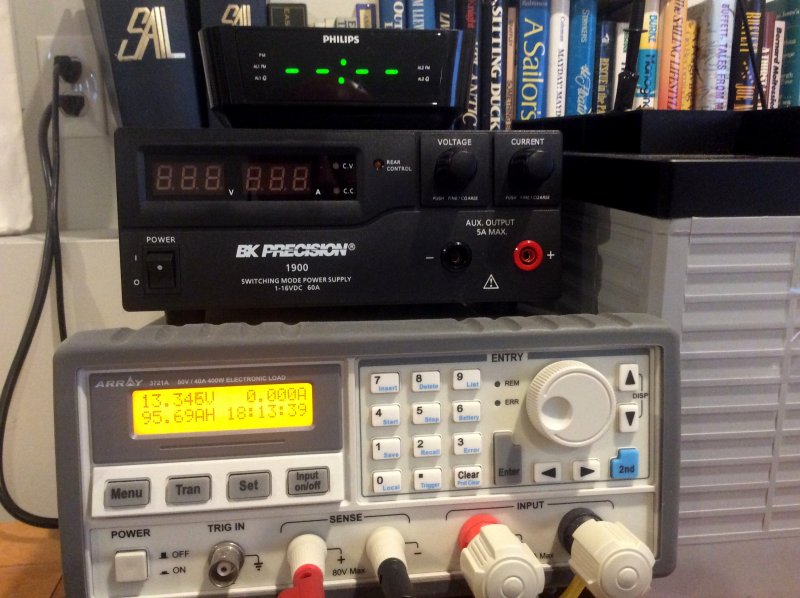
95% SOC - 5.25A Load - Volts =12.59V
The battery in this test is a very popular AGM, a Lifeline GPL-31T. It is rated at 105Ah at the 20 hour rate but this battery, off my brothers boat, was used and only capable of delivering 95.69 Ah's.
Despite the slightly diminished capacity, 91.3% of factory rated capacity, I kept the discharge rate at 5.25A at a battery temp of about 76.4F. Ideally I would have liked to have spent the time to figure out the new 20 hour discharge rate but this entails numerous tests to 10.5V and was not really that necessary for this experiment.
The 5.25A discharge rate is slightly higher than what this battery can deliver for 20 hours but close enough to make the points I wanted to make. Perhaps less than .02% of boat owners ever tests their batteries for actual capacity, so using the 20 hour rate on this battery is a bit more real world.
For a 20 hour test, or to see where your bank stands against how it is rated for capacity, a 20 hour discharge test is performed. The battery is charged to 100% SOC and then discharged at a 0.05C discharge rate. A discharge rate of 0.05C is equal to 5% of the batteries 20 hour rated capacity so 5% of 105Ah is 5.25A.
On a cruising boat the battery bank would be considerably larger and a 20 hour discharge rate would look like this:
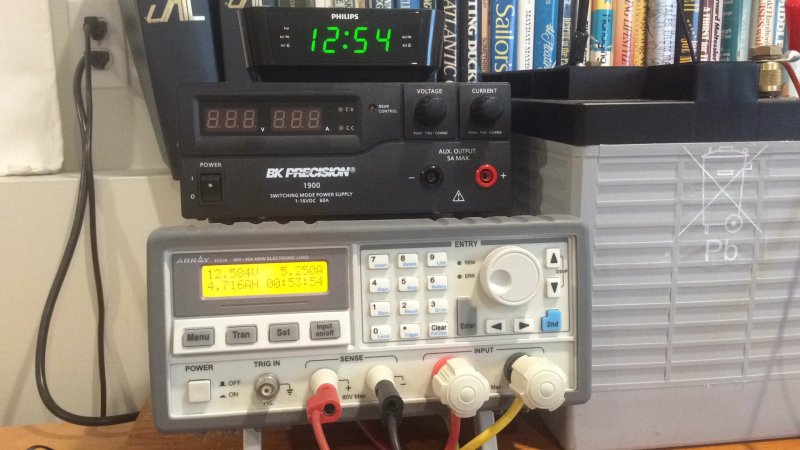
Here the battery is at approx 90% SOC with a loaded voltage of 12.55V.
Keep in mind that on a 400Ah bank this would be a 20A load in order to see this voltage at 90% SOC.
21-JAN-2016
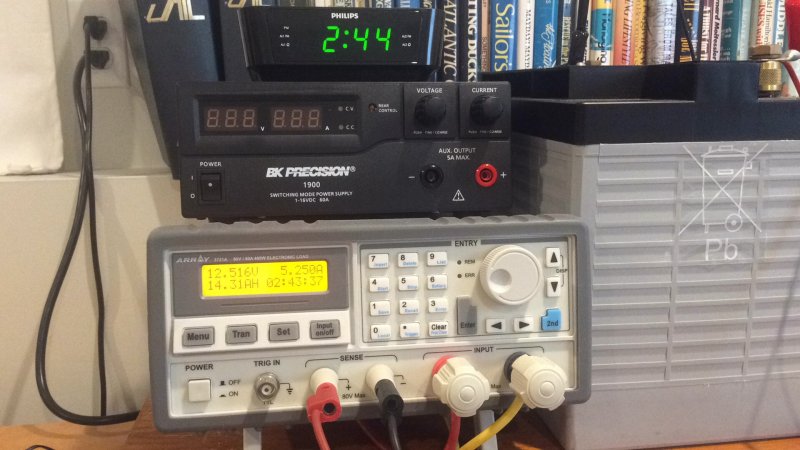
85% SOC - 5.25A Load - Volts =12.52V
As cruising boaters the average discharge rate is almost always far lower than the 20 hour rate. A typical boat with a 400Ah bank will be discharging, on average, somewhere in the 5-6A range over a 24 hour period, thus your voltages should not drop this fast with healthy batteries.
21-JAN-2016
80% SOC - 5.25A Load - Volts =12.47V
Voltage can can be used as a predictor of SOC but you really need to know the voltage performance of your battery bank against a known discharge rate and it takes work to figure out and then it will change on you as the batteries age.
This is why generic *OCV to SOC charts rarely help the average boater and often serve to actually help prematurely damage the batteries.
OCV = Open Circuit Voltage Reading
21-JAN-2016
75% SOC - 5.25A Load - Volts =12.42V
Over the years I have come to learn that most boat owners drastically over discharge their battery banks when using voltage as a predictor.
In a recent survey on SailboatOwners.com there were in excess 1000 responses, 98.4% from sailboat owners. The survey was about battery use. Of those 1000+ responses, 1188 to be exact, 72.42% of responders regularly discharged the bank below 12.1V. D'oh!!!!!
The bottom line with lead acid batteries is that even at your average house loads the terminal voltage should not be dipping below 12.1V, if you expect any sort of decent life from them.
As we can see in this experiment, under a 5% load to capacity discharge, 49.3% SOC is achieved at 12.10V.
21-JAN-2016
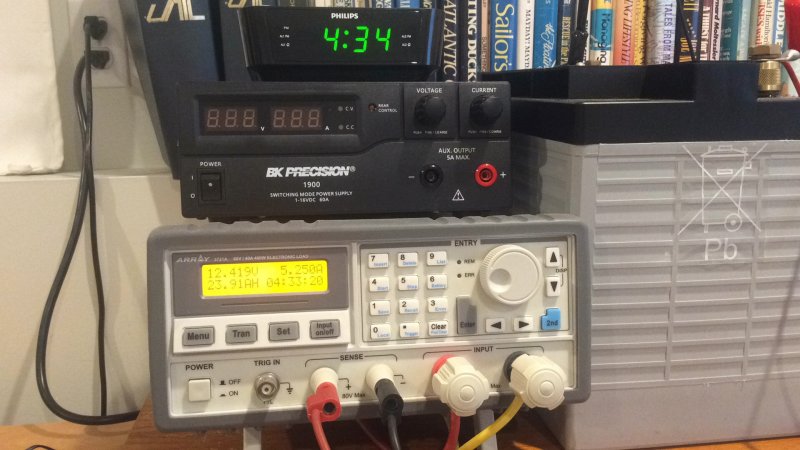
70% SOC - 5.25A Load - Volts =12.37V
Here we are at 70% SOC at 12.37V. Now compare this to the chart from above at 12.30V that was being used as a resting voltage chart. This is not a resting voltage and the battery has been under a constant 5.25A load now for nearly five and a half hours straight.
21-JAN-2016
65% SOC - 5.25A Load - Volts =12.3V
65% SOC under-load voltage = 12.3V...
21-JAN-2016
60% SOC - 5.25A Load - Volts =12.24V
60% SOC under-load voltage = 12.24V...
21-JAN-2016
55% SOC - 5.25A Load - Volts =12.18V
55% SOC under-load voltage = 12.18V...
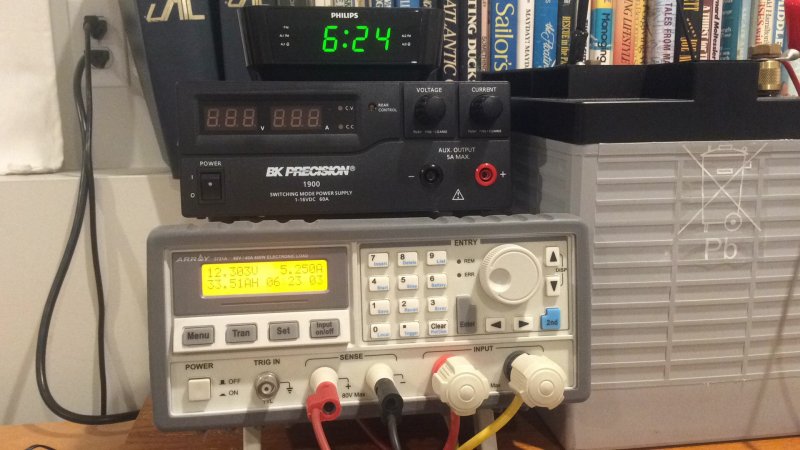
21-JAN-2016
50% SOC - 5.25A Load - Volts =12.11V
Here we are at 50% SOC, based on -Ah's removed from a baseline capacity test, after over 9 hours at a 5.25A load and the loaded voltage is still 12.11V.
If you expect or plan to use voltage as your indicator of SOC and when to re-charge I would strongly urge you to begin recharging at a maximum discharge voltage of 12.1V, even when drawing your average house loads.
Remember your house loads are a lower average load than the 20 hour rate so you will be better served to begin re-charging at 12.15V - 12.2V in order to get the most life from your bank.
******CLICK BELOW FOR NEXT PAGE******
21-JAN-2016
49.3% SOC - 5.25A Load - Volts =12.10V
Here's why I suggest you begin recharging at 12.15 -12.2V because at 12.1V this battery is already at 49.3% SOC while being discharged at 5.25A at 75F.
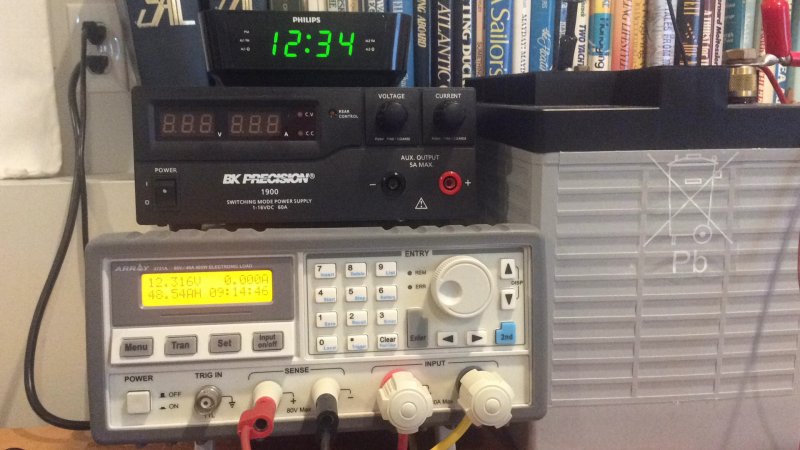
In this image we can see, at 49% SOC based on Ah capacity, the resting open circuit voltage has rebounded to 12.32V. If you had been using my customers chart for resting OCV you would have mistaken 49% SOC for 70% SOC.
With this it's easy to see how battery assassins commit murder without even being aware of it. Use voltage carefully if you plan to use it to predict SOC.
Good luck & happy boating!
MAY-2006
Help Support This Site
Like what you saw or read in this article? Was it helpful? Could the information save you some money? Would you like to see more articles like this?
If so feel free to donate, support the site, and keep it growing. Please DO NOT feel obligated at all. If you like it and want to make a donation, please do. Your donations help keep the content coming and also help keep it FREE.
Click the DONATE button below if you would like to make a donation via PayPal.